
Page 19 - Folder firmy
P. 19
Users of Asix OEE system interact with a user-friendly interface – clear presentation of measurements and KPIs in the form
of:
KPI business cards – presenting current values of indicators in graphic form;
meters – graphical presentation of current and recorded measurement values and KPIs – in the form of radial, half pie,
doughnut, linear, thermometer (bar) chart, progress bar and a scatter plot. They can refer to time frames such as the last
hour, production shift, day, week, month, quarter, year;
Gantt charts – illustrating work, stoppages, micro outages and machine shutdowns;
time charts – presenting measurements and KPIs as a function of time (year, month, week, day, production shift), in the
form of bar, line and area charts;
category charts – showing measurements and KPIs against a selected category (e.g. line, production area, machine
type, operator, product, etc.). This group includes bar charts, pie charts, and funnel charts.
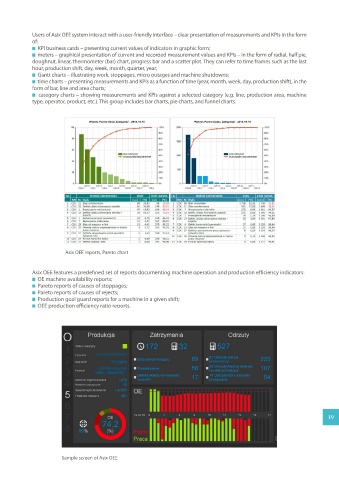
Asix OEE reports, Pareto chart
Asix OEE features a predefined set of reports documenting machine operation and production efficiency indicators:
OE machine availability reports;
Pareto reports of causes of stoppages;
Pareto reports of causes of rejects;
Production goal guard reports for a machine in a given shift;
OEE production efficiency ratio reports.
19
Sample screen of Asix OEE